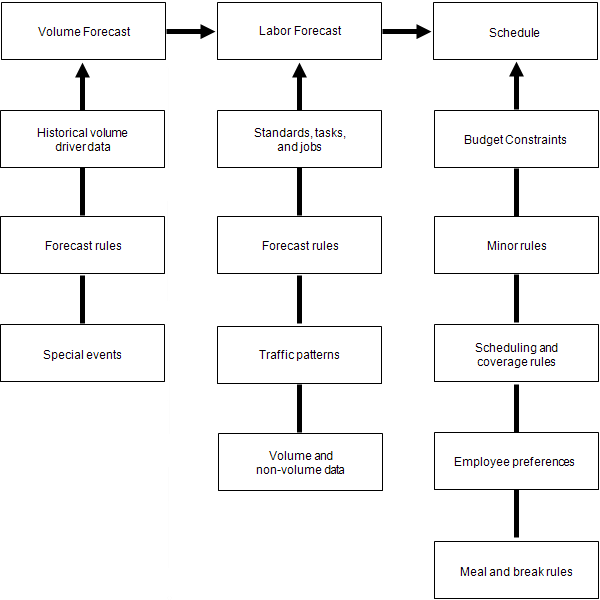
About Forecasting
Forecasting provides you with an objective and focused means to predict future labor requirements. Using rules, business drivers, and special events that you set up, as well as actual volume and other business data from previous weeks and years, it forecasts business volume and labor requirements for future date ranges at a daily level.
Forecasting has the following work spaces:
- Using the Forecast Planner you can view and modify the volume forecasts and labor forecasts that the scheduler uses to create a schedule.
- From historical volume driver data, the Forecast Planner derives a traffic pattern. Then, applying your labor standards to volume driver data and other factors, the Forecast Planner generates a labor forecast in 15-minute intervals, one week at a time.
- The system makes the labor forecast available to the Schedule Generator, which looks at individual employees and schedule rules to create a 15-minute interval schedule, one week at a time, for each selected location.
- Using the Operational Dashboard you can monitor the performance of your forecast and its impact on labor. Because the Operational Dashboard is fully integrated with Forecast Planner and KPI Builder, you can configure it to display many types of business data related to volume and labor. See the Work with the Operational Dashboard topic.
- A graphical view is available in Forecast Home.
The system uses the data and the elements you configure to generate the volume forecast, the labor forecast, and the schedule. You can import volume and labor forecasts to easily examine and analyze their performance and accuracy comparing actual and forecasted values.
The Volume Forecast
About the Volume Forecast.
The volume forecast is a prediction of how much business is going to be done at a future date. The Forecast Planner predicts weekly business volumes by day of the week based on
- Large samples of historical, actual volume data
- Configured forecast rules
- Adjustments to the predicted volumes for special events such as promotions and holidays
The volume forecast is a major component used to generate the labor forecast. For example, the number of transactions forecasted at a register drives the requirement for the number of cashiers that need to be working, the number of items forecasted to be sold in the bakery drives the requirement for the number of bakers on a given day, and so on.
Volume Forecast Intervals engine
The Volume Forecast Intervals engine, when configured, enables the volume forecast to make predictions based on fifteen minute intervals. The Forecast Planner predicts weekly business volumes by day of the week and the volume forecast intervals engine distributes the daily prediction into predictions by fifteen minutes.
The volume forecast intervals is based on Traffic Pattern engine input and the following settings:
- Business Structure attribute — Generate Volume Intervals (in Forecast Attributes) is checked.
- Function Access Control Point — Volume Forecast Intervals (in Access Profiles > Function Access Profiles > Manager - Department Manager ACPs) is set to allowed.
The volume forecast interval can be edited, and the edited value can be used to generate the labor forecast instead of using daily predictions and Traffic Pattern engine input.
To generate the volume forecast using the Volume Forecast Intervals engine, access the Volume Workspace from the Forecast Planner.
Volume forecast components
Volume drivers
Business drivers help to forecast future business volume and labor requirements. A driver is any item or unit that can be measured and tracked. Volume drivers are the source of the volume forecast.
Volume Drivers use actual site recorded data — such as POS data, patient census data, devices that count the number of customers entering a stores, pallets and cartons, and so on — to track units that vary according to the volume of the organization's business; for example:
- Sales dollars
- Number of customers
- Patients
- Number of items sold
- Number of transactions by cash, check, credit card, and so on
Dependent drivers
Dependent drivers are affected by changes to the other dependent drivers in a forecast category. If you edit the volume forecast for a dependent driver, the system updates the volume forecast for the other dependent drivers by the same percent. Non-dependent drivers, by contrast, are not affected by changes to any other drivers.
For example, if Sales, Items, and Customers are dependent volume drivers, then if you edit the number of forecasted sales for the bakery, the system changes the forecasted number for customers and items for the bakery accordingly. These new totals are rolled up into the categories above the bakery; for example, to the store. One driver can be used again and again in different categories. For example, the business driver Customers can be defined once and then used for all appropriate forecast categories.
Special Events
Special events, such as sales promotions, changing seasons, public health emergencies, and snow storms, have an impact on the volume forecast. Special event markers indicate days with volume that is probably out of the normal day-to-day range. When the Forecast Planner encounters a special event, it calculates the percent impact of the event and compensates for the impact when it generates the forecast.
Adding special events is a way to fine-tune the forecast by layering the trends from past events with current trends.
For example, some holidays fall in a different week each year. When determining the effect of those holidays, the Forecast Planner looks back to dates marked with the name of the event, because it cannot rely on information from the current date of the holiday.
Another example is forecasting the day after a holiday. A given holiday may have an impact beyond the day itself. The Forecast Planner goes back to actual day-after-the holiday data, rather than relying solely on data from any Friday in the past.
The Forecast Planner can also dismiss data for anomalies, such as storms, when volume is absent or extremely high or extremely low.
You can designate a special event as Seasonal; in this case, the event impacts only the traffic pattern, and not business volume.
For details, see Work with Special Events.
Labor forecast
The labor forecast is a prediction of how many employees are required, per job, to fulfill the projected amount of business in the volume forecast. The labor forecast is an input to the Schedule Engine.
The Forecast Planner predicts daily labor requirements based on the following:
- The volume forecast
- Labor standards assigned to tasks and task groups
- Configured forecast rules
- Traffic patterns
- Non-business drivers: static drivers, custom drivers, and fixed frequency drivers
- Hours of operation
The major factors that determine the labor forecast are the volume forecast, labor standards, and labor forecast limits.
The labor forecast indicates how much labor is required to meet the amount of business predicted in the volume forecast. The labor forecast calculates total labor hours per day per job for a week. The labor forecast converts the labor hours into the number of employees, by job, who are needed to meet the demand in each 15-minute interval per day.
For more information, see the following:
- The Labor Workspace
- View and Edit the Labor Forecast Details
- The concepts and methods of generating a labor forecast are provided in Configure the Labor Forecast.
Labor Drivers
In addition to the data from the volume drivers, the labor forecast requires three kinds of drivers that do not depend on volume:
- Static drivers— Based on physical values that do not vary with business volume, such as the size of the store. For example, the larger the store, the more security and maintenance staff are required.
- Custom drivers— Include labor data that does not vary by volume or by any static value; for example, the amount of training that new employees require.
-
Fixed frequency drivers— Specify the number of times an activity occurs in a specific time period; for example, printing a report once a day takes 5 minutes.
Note: Fixed frequency drivers are defined when you configure labor standards.
Labor standards
To get the most accurate labor forecast at the job level, the Forecast Planner requires the smallest possible measurable unit of work for its calculations; for example, 4 seconds to scan an item at the register.
Labor standards contain the time values for the amount of labor required to complete specific tasks, such as scanning an item. The Forecast Planner multiplies the time value in each labor standard by the appropriate driver data to calculate the labor requirement to complete specific tasks. The system can then determine how many hours of labor are required for the jobs that need to be scheduled.
Some labor standards are driven by volumes. For example, it takes a certain amount of time to scan so many items at a register. The labor needed to scan all the items at a register is driven by this amount of time multiplied by the number of items that are expected to be going through the register during the time period of the labor forecast.
Other labor standards are driven by criteria that are not based on volumes. Some examples of these include:
- A “floor sweep” standard that defines the amount of time to sweep the amount of floor space in your store.
- A “train new employee” standard that defines how long it takes to train a newly hired employee. This type of labor standard requires a custom driver, which defines how many new employees need to be trained in the upcoming week.
- A “run report” standard that defines how long it takes to run a report that is run once per day every day.
Labor standards are associated with tasks.
Tasks and task groups
Labor standards are grouped into tasks. For example, the labor standards for callback, handle complaint, exterior event, and so on, can be grouped into the task of customer service.
One or more tasks is assigned to a task group. Each job included in the labor forecast is associated with a task or task group. Only jobs that have a labor standard associated with them are included in the labor forecast.
The Combined Distribution feature lets you combine labor standards for a task so that the labor is distributed more evenly.
Combined Distribution
Combined Distribution allows you to combine labor standards for a task in order to achieve more even labor distribution. This option ensures that any fractional head counts that occur during the labor calculation process for individual labor standards are accumulated, and then redistributed to the specified job within the configured labor period.
The combined distribution functionality
- Generates a more evenly distributed labor forecast curve for a day
- Minimizes gains and losses in labor forecast hours due to rounding
- Uses planned resources — both demand driven and fixed — more effectively to honor minimum requirements defined in labor forecast limits
The combined labor distribution option works well when
- Labor standards use Apply Rounding
- The combined labor standards are configured to Distribute by Traffic Pattern.
The combined distribution option does not work for
- Labor standards that are configured to Distribute Evenly with the option Spread Remainder Left or Spread Remainder right selected.
- Time Independent Labor Standards
In the event that one or more labor standards selected for combined distribution have Spread Remainder Left or Spread Remainder Right selected, the system automatically overrides the labor standard configuration to Apply Rounding. If this is done, this is noted in the log file.
How combined distribution works: The daily resource pool
Any fractional head count that is generated during the labor calculation process is added, by job, to a daily resource pool. Rather than rounding, for example, 3.5 of a head count requirement up to 4 or down to 3, the system puts the 0.5 into the resource pool. This labor is then distributed within the combined distribution time period for the labor in the following priority order:
- Ensure minimum requirements are met.
- Ensure that any fractional head count in any 15-minute interval is rounded.
-
Make sure that any resources that were lost during the labor calculation process for an individual labor standard is accumulated. Distribute any remaining resources using the selected distribution method:
Spread right— Spreads remaining resources in the resource pool starting at the end of the distribution time period, working toward the beginning of the distribution period until resources are used up.
Spread left— Spreads the remaining resources in the resource pool starting at the beginning of the distribution time period, working toward the end of the distribution period until resources are used up.
Optimal spread— Redistributes any remaining labor to the appropriate time periods in the labor forecast curve. This ensures that the final labor forecast curve for the job is smoothed.
Example
A simple example of the combined labor distribution concept is shown using five fixed labor standards for a store clerk. Assuming that each of these labor standards has the same labor period of one hour (9 A.M. – 10 A.M.) on a given day, the raw labor forecast generated for each interval of the day is as follows:
|
Labor Standard |
9:00 A.M. |
9:15 A.M. |
9:30 A.M. |
9:45 A.M. |
|---|---|---|---|---|
|
1 |
1.5 |
1.5 |
1.5 |
1.5 |
|
2 |
2.0 |
2.0 |
2.0 |
2.0 |
|
3 |
2.5 |
2.5 |
2.5 |
2.5 |
|
4 |
1.5 |
1.5 |
1.5 |
1.5 |
|
5 |
1.75 |
1.75 |
1.75 |
1.75 |
|
Total (raw head count) |
9.25 |
9.25 |
9.25 |
9.25 |
If we do not apply combined labor distribution, then the raw head count of 9.25 for the day is rounded down to 9 in the final labor forecast. Hence, the overall loss in the labor forecast for the day is 0.25 hours, or 15 minutes.
If we do apply combined labor distribution to the five labor standards in the example, then each 15-minute interval contributes 2.25 head count to the daily resource pool. Hence, the size of the resource pool for the day is 2.25 x 4 = 9 head count.
If the Spread remainder left combined distribution method is used, then labor distribution from the resource pool is:
|
Pass |
9:00 A.M. |
9:15 A.M. |
9:30 A.M. |
9:45 A.M. |
Pool size |
|---|---|---|---|---|---|
|
Before CLD |
7 |
7 |
7 |
7 |
9 |
|
First pass |
8 |
8 |
8 |
8 |
5 |
|
Second pass |
9 |
9 |
9 |
9 |
1 |
|
Third pass |
10 |
9 |
9 |
9 |
0 |
the final labor forecast is:
|
9:00 A.M. |
9:15 A.M. |
9:30 A.M. |
9:45 A.M. |
|---|---|---|---|
|
10 |
9 |
9 |
9 |
In this example the final labor forecast after combined distribution is 9.25 hours and we do not get any loss in the labor forecast from rounding.
Labor forecast limits
Labor forecast limits include minimum and maximum labor coverage requirements for jobs and job rounding factors.
- You can set minimum and maximum labor coverage requirements for a job regardless of the amount of business volume that the Forecast Planner calculates. For example you may always want a minimum number of cashiers scheduled no matter how low the volume forecast. And, if you have 13 registers, you probably do not want more than 13 or 14 cashiers scheduled no matter how high the volume forecast.
- You can set a rounding factor for each job. When the labor forecast engine converts forecast hours to head count, a fraction of a person, such as 3.7 people, often results. You can set the point at which to round the head count requirement up, for example, to 4 or down to 3.
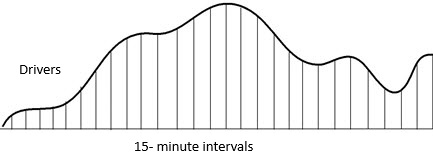
Traffic Patterns
Traffic patterns tell the Forecast Planner how to distribute the labor forecast by showing how business volume fluctuates during a day; for example, what times have high volumes, and at what times does volume drop off.
To calculate a traffic pattern, the Forecast Planner uses historical data from volume drivers on similar days in the past. For example, to forecast next Monday, it looks at three points:
- Last Monday — 30 customers were in the store between 9 A.M. and 10 A.M.
- Two Mondays ago — 10 customers were in the store between 9 A.M. and 10 A.M.
- Three Mondays ago — 74 customers were in the store between 9 A.M. and 10 A.M
From this volume driver data, the Forecast Planner can forecast approximately how many customers will be in the store between 9 A.M. and 10 A.M. next Monday.
To distribute the forecasted labor correctly in 15-minute intervals, the Labor Forecast Engine does one of the following:
- Divides the labor requirement evenly across the labor period
- Applies the traffic pattern that is derived from actual historical data and the parameters you enter during setup.
After the labor forecast distributed correctly, the system is ready to find real employees and schedule them to the jobs and shifts that can fulfill the business requirements.
You can export a traffic pattern for stores or departments before you generate the labor forecast. You can compare the 15-minute interval values in the labor forecast to values in your internal reports. If necessary, you can edit the values and then import the values back into the system where they are used when you generate your labor forecast.
About the traffic pattern engine
An overview of the traffic pattern engine.
When you run the traffic pattern engine, the traffic pattern is stored in the database. Running the traffic pattern engine enables you to:
Export the traffic pattern via API, which allows for this information to be extracted in bulk.
Use the traffic pattern as a basis for Dataviews.
If you do not run the traffic pattern engine, a traffic pattern will be generated during the labor engine execution, but it will not be persisted in the database. In such cases, the traffic pattern can change due to changes in the incoming volume data thereby causing small changes to the labor forecast.
Understanding how the traffic pattern system setting works
An explanation of how site.forecasting.engine.labor.dotrafficpatterncalculation.enable functions depending on whether it is set to true or false.
The method you use to create the traffic pattern will be determined by the site.forecasting.engine.labor.dotrafficpatterncalculation.enable system setting:
- True (default setting) - The system looks in the database to determine whether a traffic pattern exists for that day. If no traffic pattern exists, the system will generate the traffic pattern as part of the labor forecast generation.Note: If this setting is set to true, you do not need to import a traffic pattern.
- False - The system will always read the traffic pattern from the database. If no traffic pattern exists, minimum amounts of labor may be generated.
Enable the traffic pattern calculation
Steps for enabling the traffic pattern calculation in the system.
- Navigate to the tab.
- Locate the
site.forecasting.engine.labor.dotrafficpatterncalculation.enablesystem setting. - Set it to true.
- Select Save.
Machine learning and an enhanced intraday distribution
An explanation of how using machine learning with a traffic pattern calculation can generate an enhanced intraday distribution.
Traditionally, the traffic pattern calculation uses a defined formula to determine which days to use in the calculation of the traffic pattern and calculate the traffic pattern. Machine learning offers a new way to calculate and generate a traffic pattern. Using machine learning to generate the traffic pattern can lead to an improved intraday distribution as more data can be considered.
Configure the traffic pattern batch task
Steps for configuring the traffic pattern batch task.
To configure the traffic pattern batch task, go to:
Configure the TRAFFIC_PATTERN batch task to run with machine learning.
- In the configuration of the TRAFFIC_PATTERN batch task, append
/mlto the batch task string as shown in the following example:./W0 /ml - Select Save.
Configure the Traffic Pattern tab
To configure the TRAFFIC_PATTERN batch task to run with machine learning, go to:
- Enter a weight for each of the listed criteria. The Forecast Planner uses these weights to find the days with the most similar properties. The Total of the weights must equal 100%.For example, if you entered 4 in Days of Volume History to Use on the Volume tab, the system finds the 4 days that most closely match your criteria, and it uses the weights you enter when it scores each candidate day.
-
Same Day of Week— If you are forecasting for a Monday, the system finds other Mondays.
-
Nearest Day— If you are forecasting for Friday, the system looks at Thursdays. If you are forecasting for Monday, the system looks at Tuesdays.
-
Event— The system finds days with like events.
-
Same Open/Close Time— The system finds days when the store hours are the same as those for the day it is forecasting.
-
- In Days of Pattern History to Use, enter the number of days for the system to use to determine the traffic pattern. The system scores like days and uses the highest scoring days to create the traffic pattern.
Hours of Operation
The Forecast Planner uses the hours during which a site or department is open for business when it:
- Calculates the traffic pattern
- Creates the labor forecast
Labor standards can be configured to distribute labor requirements relative to a store’s hours of operation; for example, the labor requirement for setup starts 15 minutes before the store opens, and clean up runs until 15 minutes after the store is closed.
Hours of operation can be configured to be regular hours, which are based on standard open and close time for each day of the week. Override hourscan be configured to define changes to the standard hours for a specific date, such as a holiday.
Hours of operation are assigned to categories at the department level or above on the business structure. The hours of operation assignments can be effective dated.
All departments in the store inherit their hours of operation from the site. However, if a department has different hours than a site, it can be assigned to a different set of hours of operation to the department.
Corporate can create an hours of operation and deny a store the ability to edit it.
View and Edit the Labor Forecast Details
After running a labor forecast, you may want to check labor hours and headcount to see if they line up with expectations for jobs and departments at specific times on specific days. You can do this by drilling down to the daily labor forecast.
You can also set up a view to examine the effect of modifying forecasted volume values on labor requirements. Add volume drivers to the forecast factors in the Labor workspace as detailed in Forecast Factors.
To access the detailed views for the jobs in a department, or for a single job:
- Select a department location path. (See Select a Location.)
- Select a forecast week. (See Select a Forecast Week.)
- Select a favorite factor view that includes labor hours, jobs, or both.
-
To view or edit the breakdown values for a forecast factor, do one of the following:
- In the Forecast Factors column, click a cell labeled Labor Hours - Forecasted - (any week) to view or edit the forecasted headcounts for all the jobs in that department. See Daily labor forecast by department for details.
- In the Forecast Factors column, click a Job (any job) to view or edit the forecasted headcount and additional details for that job. See Daily labor forecast by job for details.
Daily labor forecast by department
You can view and edit the labor forecast data in greater detail for all the jobs in a department:
View the daily labor forecast by department
You can view the headcount values of a forecast for a department. The full path to the department appears at the top left in read only text. (To change the location, return to the Labor workspace.)
Just below this is Labor Hours for followed by a date selector which indicates the date and time range of the data displayed.
- To navigate through the forecast week, click Next
, or Previous . - To display data in another forecast week, click Select Day
and click the date. - To change the Start Time or End Time of the displayed 15-minute increments, enter new values.
If you are working with a budget, daily and weekly budgeted hours for the department appear in the top row of the table (above the table headers). Click More to display tables of values for daily and weekly hours for the department and for each job.
The next row contains column headers identifying the data displayed in the rows below:
- Time- Indicates the interval for which values are forecasted
- [Job Title]- Indicates the job related to the headcount values listed in that column
-
Note:
- There may be only one job, or more than one job in a department.
- The job title or titles may differ at each location.
- To hide a displayed job column, or display a hidden one, click
. A check mark next to a job title means the job is displayed. Click to job title to toggle the display. - To see a breakdown of the headcount for a specific job, click the header for that job. See Daily labor forecast by job
- All Jobs Total- The sum of all the headcount values listed in a time slice
The bottom row of the table shows the total hours represented by the 15-minute headcounts for each column. For example, with a headcount of one, four 15-minute slices equal one hour of labor. Total Hours Forecasted(the value before the slash (/) sums the values you have modified with unmodified values. System Generated(the value before the slash (/) refers to the unmodified values generated by the last saved labor forecast.
Edit the displayed daily labor forecast for a department
- Double-click the headcount for a job at a specific time
- Type the modified value.
-
(Optional) If you want to examine the effect of your changes on other values, click
Calculate Totals
or to incorporate your changes in the adjusted totals in the Total Labor Hours section. Each increment increases the adjusted labor value (for the job and the total) by 0.25 hours because 15 minutes is 25% of a labor hour. Note: Clicking Calculate Totals does not save the change, it only updates related values on the screen. This gives you the opportunity to examine the overall effect of the changes you have made before saving them. If the effect is not what you expected, click Refresh. If the effect is satisfactory, click Save. -
Do one of the following:
- To save your changes, click
Save
- To delete your changes for the session and revert to the last saved values, click
Refresh
.
- To save your changes, click
Save
- You can select another day and make edits if desired.
Daily labor forecast by job
You can view and edit the labor forecast data in greater detail for an individual job in a department:
View the daily labor forecast by job
You can view the forecasted headcount values for an individual job. The full path to the job appears at the he top left in read only text. (To change the location, return to the Labor workspace.)
Just below this is Labor Hours for followed by a date selector which indicates the date and time range of the data displayed.
- To navigate through the forecast week, click Next
, or Previous . - To display data in another forecast week, click Select Day
and click the date. - To change the Start Time or End Time of the displayed 15-minute increments, enter new values.
The next row contains column headers identifying the data displayed in the rows below.
- Time- Indicates the interval for which values are forecasted
- Headcount- The forecasted headcount values listed in that column. This is the data you can modify.
- Raw Requirement- The system-generated labor requirement from the most recent labor forecast. Expressed as a headcount that may include fractional values.
- Rounded Requirement- The raw requirement rounded to a whole number. Corresponds to the Headcount column before any modifications.
- Unallocated/Unassigned- The difference, positive or negative, that shows how much the raw requirement was rounded up or rounded down, respectively, to create the rounded requirement.
The bottom row of the table shows the total hours represented by the 15-minute headcounts for each column. For example, with a headcount of one, four 15-minute slices equal one hour of labor. Total Hours Forecasted(the value before the slash (/) sums the values you have modified with unmodified values. System Generated(the value before the slash (/) refers to the unmodified values generated by the last saved labor forecast.
View the details of jobs and tasks in the labor forecast
Managers can access the details of labors standard calculations for each job to troubleshoot issues with the labor forecast. They can also drill down into the labor standard calculation detail by 15-minute intervals to evaluate the contribution of each labor standard to the total labor forecast hours.
The following options work independently:
Click Tap Show Tasks to add a column to the table for each task that is assigned to the job. Each cell displays the total minutes of labor calculated for that 15-minute interval. Totals are shown in both hours and minutes. The total for each task appear in the bottom row. (Note that the task data cannot be edited.)
Click Tap Show Standards to add a column to the table for each labor standard that is assigned to the job, and shows its calculated value. Each cell displays the total minutes of labor calculated for that 15-minute interval. Totals are shown in both hours and minutes. The total for each standard appears in the bottom row. (Note that the labor standard data cannot be edited.)
Export the data for a job
You can export the data for a job to Excel for further analysis. All data is exported, including tasks and labor standards, whether it is currently displayed or not.
Edit the displayed daily labor forecast for the job
- Double-click the headcount for a job at a specific time
- Type the modified value.
-
Click
Calculate Totals
to incorporate your changes in the Total Hours Forecasted. Each increment increases the adjusted labor value (for the job and the total) by 0.25 hours because 15 minutes is 25% of a labor hour. -
Do one of the following:
- To save your changes, click
Save
- To delete your changes for the session and revert to the last saved values, click
Refresh
.
- To save your changes, click
Save
- You can select another day and make edits if desired
See the effect of volume changes have on headcounts
-
You can include volume drivers as a forecast factor in the Labor workspace. This can provide an easy way to check the effect of volume changes on labor headcount.
Scenario: Having executed both a volume run and a labor run for a department and examined the forecasted headcount for a job, you now want to see what would be the potential impact of a sudden increase in volume on forecasted headcount for that job.
- In the Volume workspace, add a forecast factor to show the forecasted volume driver values for the department.
- In the Volume workspace, add a forecast factor to show the forecasted volume driver values for the department.
- Double-click a forecasted volume value and make the modification.
- Click on Calculate Totals
to see the effect on related values in the table, if any. If you want to keep all these values and proceed, click Save . If not, click Refresh . - Run the labor engine:
- Click Run Labor. The Run Labor panel opens.
- Select the loaded location you want to run. The location must be a site or a department and you must have already have run a labor forecast for the location.
- Note that any metrics that are used in the constraint are evaluated at run time for the current forecast week.
- Click Run.
- To check the progress of the volume run, click Tools
> Engine Status. The Engine Status panel opens showing active engine runs and their status. To update the engine status, click Refresh . - When the run is over, click OK.
- Compare the previous headcount for the job to the current headcount. If you want to keep the new headcount values, click Save
. If not, click Refresh and click . - (Optional) If you want to revert the volume forecast to the previous values, click Restore Volume
,
Forecast Home
Forecast Home shows a graphical view of the Volume data. It shows weekly volume in a bar graph for a single location. The graph is read-only and you cannot edit the volume.
See the Forecast Home topic.