How to personalize a Dataview
- From the Main Menu, select Dataviews A configurable tool for analyzing data and taking actions on a group of employees or an organization. & reports > Dataview Library.
- On the Dataview Library page, clicktap the Dataview that you want to personalize.
- In the Dataview, clicktap Select Timeframe
to select the time frame that you want to view, or navigate to another time frame by using the arrows. - ClickTap Select Hyperfind A search engine that filters and selects groups of employees through queries that specify conditions or locations (criteria).
to select the employees or location in your organization that you want to analyze, for example, All Home A query that returns a list of employees associated with a manager's employee group. All Home finds people who are active employees or active users as of today. or Manufacturing.
Dataview appearance
The appearance of your Dataview depends on your screen resolution: List view is for screen resolutions below 768 pixels and Grid View is for screen resolutions above 768 pixels. You can also show or hide columns in your Dataview.
List View
List view displays a list of data records. With List View you can:
- Tap the check box next to each record to select one or multiple records.
- Tap the arrow
- Tap the main body of the record to open a glance (also known as a contextual callout) Provides information and actions in a dialog box for an item on the screen when the user right-clicks or taps the item. that lets you perform actions, such as approving a timecard or adding a paycode A category of time or money that employees earn, for example, Regular Hours, Bonus, or Sick..
The List View displays a list of data records. With List View you can:
- Click the check box next to each record to select one or multiple records.
- Click the arrow
- Right-click the main body of the record to open a glance that lets you perform actions, such as approving a timecard or adding a paycode.
The Grid View displays the data records in a tabular format. With Grid View you can:
- Click the check box next to each record to select one or multiple records
- Right-click the main body of the record to open an action menu that lets you perform actions, such as approving a timecard or adding a paycode.
You can show or hide the columns in the Dataview by using the following methods:
Method 1: From the column header- ClickTap the drop-down arrow in the column that you want to hide. Select Hide Column.
Method 2: From the Filter
- ClickTapFilter
Note: The Show/Hide column is not available in the list view.
Refine options
To use the Refine tool:
Select Refine
Note: You can also access most of these tools by selecting the drop-down arrow in each column and selecting the function from the context menu.
Use Sort to control the order of the data that is displayed in the table.
Method 1: From the column header
- In the column that you want to sort, clicktap the column heading once to sort in ascending order.
- ClickTap a second time to sort in descending order.
- ClickTap a third time to remove the sort.
- You can also clicktap the drop-down arrow next to the heading and sort the data.
Method 2: From the Refine slide out panel
- ClickTap Sort and the column you want to sort.
- ClickTap Sort Ascending, Sort Descending, or No Sort.
- ClickTap Apply.
- The Sort Ascending
Multiple column sort
You may want to sort using multiple columns for a variety of reasons. For example, you may want to sort employees by their status, and then sort the employee list by badge number to make sure that the badges of terminated employees have been inactivated and returned.
Select multiple columns to sort
- ClickTap the first column (indicated by
- If you select a second column (indicated by
- If you select a third column (indicated by
Note: If you click a column header directly, any previously applied multiple sorting is removed and the grid sorts on the selected column.
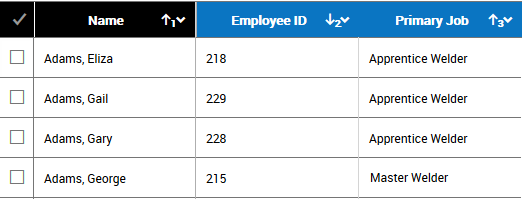
Multiple sort example
The following example shows:
- Name, in ascending order
- Employee ID , in descending order
- Primary Job, in ascending order (duplicate numbers are grouped together)

You can remove the sort several ways:
- From the Refine panel> Sort tab, select No sort
- From the column header, select the drop-down arrow and deselect the sort
- Click the column header until the sort is removed
Sort removal notes
- If you remove the only sort applied in the Dataview, then the Dataview is sorted by the default sort order, usually by Employee Name or Org Name.
- If the Dataview has been sorted by two columns, then if you remove the primary sort, then the secondary sort immediately becomes the primary sort.
- If three or more sorts were defined and the second one is removed, then the third sort becomes the secondary sort.
Select a filter to narrow the results in the Dataview to the specific items that you are interested in viewing, such as the number of part-time employees in your organization, or the top ten employees with overtime hours.
From the Refine panel.
- ClickTap Refine
- ClickTap Filter and the column that you want to filter. The Available filters by data type selection is based on the context of the column. For example, a numeric column may have filter selections such as, Equal, Greater Than, and so on. You can select multiple filters at the same time.
- Type the value for the filter.
- ClickTap Done.
- ClickTap Apply.
You can filter the data by two different methods.
Method 1: From the Refine panel.
- ClickTap Refine
- ClickTap Filter and the column that you want to filter. The Available filters by data type selection is based on the context of the column. For example, a numeric column may have filter selections such as, Equal, Greater Than, and so on. You can select multiple filters at the same time.
- Type the value for the filter.
- ClickTap Done.
- ClickTap Apply.
Method 2: From the Filter menu
Note: This method is not an accessible feature.
- ClickTap Filter
- Select Show Filters row.
- The filters appear at the top of every column.
- Select the Available filters by data type from the drop-down arrow in the first filter row. You can select multiple filters at the same time.
- Type the value of the filter in the second filter row.
- Press Enter.
Note: Your selected filters do not persist for future sessions, unless you save the Dataview.
With either method, the Filter
- ClickTap Filter
- ClickTap Clear all filters.
- ClickTap the record in the list with the filter.
- ClickTap the Filter tab.
- ClickTap Delete
-
Equal (=) (default)
-
Not equal (!=)
-
Greater Than (>=)
-
Less Than (<=)
-
Greater Than or Equal to (>=)
-
Less than or equal to (>)
-
Is null
-
Is not null
-
Between - use semi-colon (;) as separator. For example, to search for the names between b and n, use b;n. The results give you all the names beginning with the letters from b through mz.
-
Not between - use semi-colon (;) as separator. For example, to search for the all names except those between b and n, use b;n. The results give you all the names that begin with a and the names that begin with the letters m-z.
- Starts with (default)
- Not starts with
- Custom - uses regular expressions (regex), which are special text strings that describe a search pattern to find items within a body of text. They work similarly to wild cards, but you can construct them to search for more complex and sophisticated patterns.
- Custom filter search examples:
- .*data.* – all entries that contains the word data.
- AA;ZZ – all items between AA and ZZ
- U[Sb]A – USA or Uba
- U[r-t]A – a range of characters, in this case Ura, Usa, Uta
- (?!USA).* – any value that is not USA.
Note: For the most comprehensive list of regular expressions, search the Internet for regex.
- In
- Not in
Note: If you use more than one value for IN or NOT IN, each value must be separated by a semicolon.
- Equal (=)
- Not equal (!=)
- Is null
- Is not null
- Between - use semi-colon (;) as separator. For example, to search for the names between b and n, use b;n. The results give you all the letters from b through m.
- Not between - use semi-colon (;) as separator. For example, to search for the all names except those between b and n, use b;n. The results give you all the names that begin with a and the names that begin with the letters m-z.
Date
- Equal (=) (default)
- Not equal (!=)
- Greater than (<)
- Less than (>)
- Greater than or equal to (>=)
- Less than or equal to (<=)
- Is null
- Is not null
- Between - use the calendar to select a date range.
- Not between - use the calendar to select a date range.
Note: When you select a date from the calendar widget in the filter, it appears as a short date, for example, 1/17/2015. However, the application translates it to a long date that includes the time at midnight, for example, 1/17/2015, 12:00:00 AM. This means that some filters, for example between or greater than, may not render the expected results.
Boolean
- All (default)
- Yes
- No
Use Group to group the records that share a specific attribute, such as the same Primary Labor Account.
Method 1: From the column header
- ClickTap the down arrow on the column that you want use for grouping.
- ClickTap Group by this column.
Method 2: From the Refine slider:
- ClickTap Group and the column you want to use for grouping.
- ClickTap Apply.
- The selected column is hidden and the unique values contained within the column form groups. If preferred, you can show the column again by selecting Filter
on the far-right side of the column headers and checking the column header name. - For every unique value in the chosen column's data set, a section header appears in the grid, and all rows with a matching value in the chosen column are listed under the header.
- If you select an additional column to group by, it becomes secondary to the first grouping, and so on, following the order in which they are chosen.
- All groups containing duplicate values are contained within their own section header.
To cancel grouping
- From the Refine slider, select Group and the column for which you want cancel grouping.
- Select No Group.
Note: You cannot group by numeric columns.
You can apply summarizations to each of the columns in the table. The available summarizations are Count, Sum, Average, Minimum, Maximum, and None.
Method 1: From the column header
- ClickTap the drop-down arrow in the column header where you want to apply a calculation.
- ClickTap the calculation that you want to use.
Method 2: From the Refine slider
- ClickTap the Calculate tab in the Refine slider.
- ClickTap the column head for which you want a calculation.
- ClickTap from the list of calculations.
- ClickTap Apply.
- For all numeric columns, the following summarizations are available: None, Sum, Average, Minimum, and Maximum
- For all string columns, the following summarizations are available: None, Count (number of rows)
- For all date columns, the following summarizations are available: None, Count (number of rows)
- For all Boolean columns, the following summarizations are available: None, Count
If you group data, and one of the columns has a summarization applied, a sub-total row appears for each group that summarizes the data in that group. For example, if a collection of employees appears in the Total # of Worked Hours column, and SUM has been applied, if you group by an employee attribute such as Labor Category, for every unique Labor Category each employee falls into, a sub-total line appears.
Drag and hold the column heading while moving it laterally to the new location.